Complete Guide to Google Analytics 4
Originally published: February 09, 2022 11:37:45 AM, updated: November 19, 2022 12:00:00 AM

Before diving into the specific capabilities that GA4 offers, it's important to note the differences between the previous Google Analytics versions.
The first differentiating feature of GA4 is its data model, which is entirely focused on events rather than pageviews batched into sessions, as it was with its predecessor, Universal Analytics (UA). Compared to prior Google Analytics iterations, GA4's event-driven data model offers more flexibility because it enables a unified tracking system for web and applications that isn't wholly limited to URLs. Sessions and pageviews did not magically vanish; they still exist but are recorded as independent events, unlike what it may appear.
Data collection and sampling thresholds are other vital aspects that deserve to be highlighted. The free version of Universal Analytics had some limitations regarding the amount of data that could be collected—10 million hits per property each month—which might not sound like a lot for high-traffic websites. GA4 removes this restriction by allowing unrestricted data collecting and removing any chance of sampling from standard reports.
Hit types
Page hits, event hits, eCommerce hits, and social interaction hits are all sorts of Universal Analytics hits.
Google Analytics 4 data, on the other hand, is event-based, with the idea that any interaction can be recorded as an event. As a result, Universal Analytics property hit types correspond to Google Analytics 4 property events.
Google Analytics 4 events
The information in your reports is derived from events that occur when users interact with your website or app. When a user visits a page on your site, a page view event is triggered.
Without using any code, you can collect the following events:
Automatically collected events
When you set up data collection, automatically collected events are collected.
Enhanced measurement events
When you enable enhanced measurement, it automatically collects enhanced measurement events. Individual enhanced measurement events can be collected or not collected in Admin.
You can add the following events to your code for more advanced data collection:
Recommended events
Recommended events are those that you create but have names and parameters that are predetermined. Existing and future reporting capabilities are unlocked by recommended events.
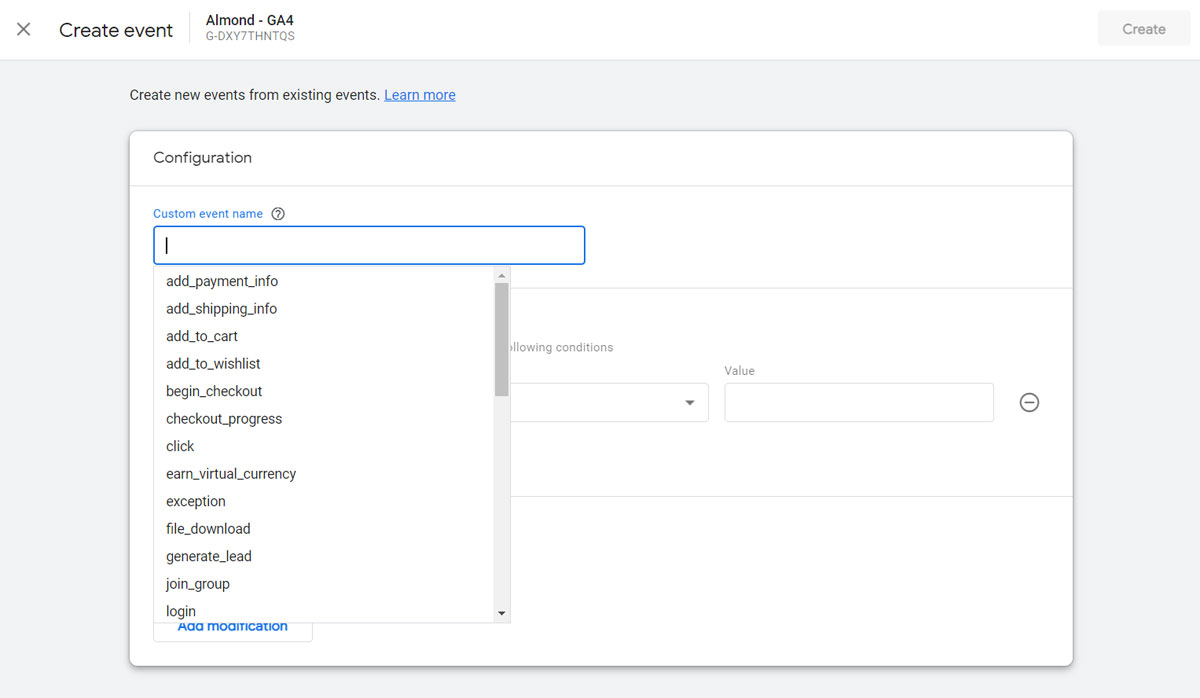
Custom events
Custom events are those that you create and name. Only create bespoke events if none of the other categories' events fit your needs. Most basic reports do not include custom events. For significant analysis, you'll need to create custom reports.
Recommended video: Events in Google Analytics 4 // Automatic, Recommended and Custom Events in GA4.
Pageviews and screenviews
Universal Analytics page views correspond to the page view event in Google Analytics 4 characteristics. The config gtag command or the Google Analytics 4 Configuration tag in Google Tag Manager immediately causes a page view event.
The app equivalent of a pageview is a screenview. A screen view event is triggered in Google Analytics 4 properties whenever a user visits a screen.
Google Analytics 4 sessions
As more people begin the process of migrating to the new Google Analytics 4 for website tracking, they realize that the session counts change dramatically from earlier Google Analytics releases (a.k.a. Universal Analytics). My advice is to avoid focusing on sessions and instead concentrate on user engagement with your content.
Users will be perplexed when comparing session metrics between Universal Analytics and Google Analytics 4 because the two systems are designed to be extremely different. The number of sessions per day has practically lost all value, and it should not be displayed prominently in any report.
Universal Analytics was created when consumers used to open a browser, navigate to a website, potentially look at multiple pages, and then close it. People no longer browse in this manner; instead, they keep a browser open at all times, opening new tabs to various pages that they may return to read at a later time (or date) and then closing it.
One of the most common criticisms of Universal Analytics was that it didn't track user involvement with a page; if they didn't go to another page, the time spent on that page was zero. Google Analytics 4 solves this by tracking various user engagement events, the most popular of which are time (a.k.a. user engagement), click, and scroll.
When you combine these two elements, it should be clear that a person can open a page in a tab and return to it hours later to read the information before closing the tab. Universal Analytics would have identified that as a session with a pageview and would have been unaware of the subsequent engagement. Google Analytics 4, on the other hand, interprets it as a page view session followed by a session with user activity hours later – it records a second session with no page view event! This occurs more frequently than you might expect.
Recommended video: Engaged Sessions in Google Analytics 4 properties
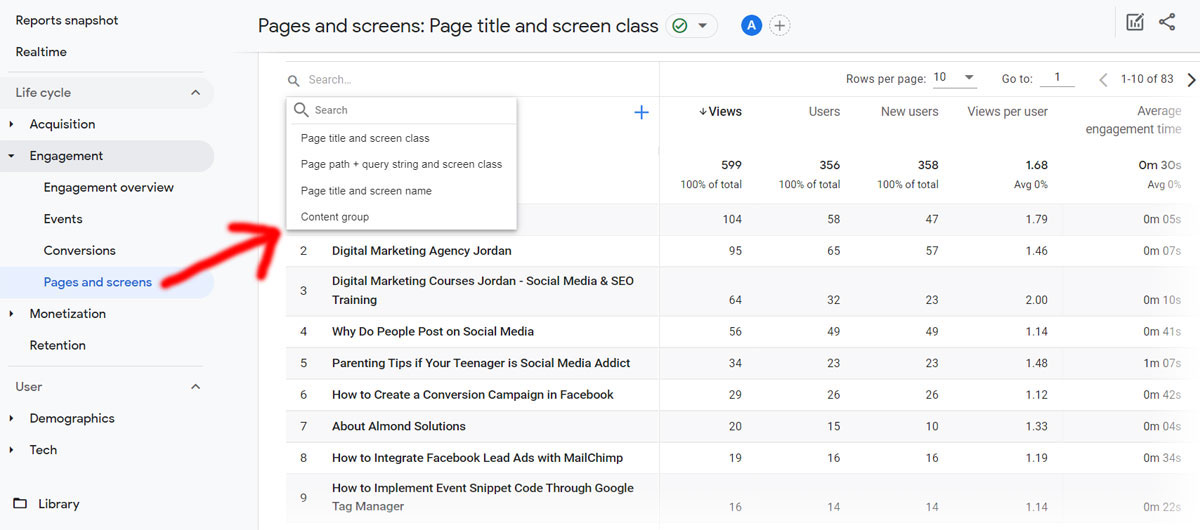
Content groups in Google Analytics 4
First, here's where you'll find Google Analytics 4's new Content Groups feature: We can retrieve the values by going to Reports> Engagement> Pages and Screens and clicking on the "Content group" field.
Content grouping in Universal Analytics allows you to organize content into logical groups and then examine and compare data by group name. For instance, you may see the total number of pageviews for all pages in a category like 'Men/Shirts,' and then drill down to see each URL or page title inside that category.
One preset event parameter for the content group ("content group" in gtag.js or "Content Group" in GTM) populates data into the "Content Group" dimension in Google Analytics 4. Additional Universal Analytics content group dimensions can be developed as event-scoped custom dimensions in GA4 and used independently.
Conversions in Google Analytics 4
Goodbye, goals. Hello, conversions!
The name "Google Analytics Goal" is recognizable to those who have worked with prior versions of Google Analytics, such as Universal Analytics. That's how Google Analytics was calling conversions in the past.
Create a destination objective if you want to treat a page view of the order confirmation page as a conversion. Other sorts of Google Analytics goals that you could build include:
- Duration
- Pages/Screens per session
- Event
It's also worth noting that each GA view allows you to create up to 20 goals. The restriction in GA 4 is 30 conversions per property.
The concept of Google Analytics 4 goals has vanished with the introduction of GA4. Conversions are now the most significant interactions (this name has been used by the industry and other marketing/analytics tools for many years, and even GA users used to refer to objectives as "conversions").
In actuality, it's a much-welcomed and long-overdue cosmetic upgrade. The name, though, isn't the only thing that's altered. When it comes to conversions, Google Analytics 4 has a lot of new features:
- We must uniquely configure them.
- There are various types of conversions.
Now it's all about the event. It's your job to send them out and label the most crucial ones as conversions.
There are two options (that you can modify) and one that is predefined when it comes to configuring conversions in Google Analytics 4.
Recommended video: Google Analytics 4 Conversion Tracking // How to set up and track conversions in GA4.
Machine learning replaces cookies
With the adoption of GDPR legislation in Europe and increased internet privacy, tracking users with cookies is getting more challenging. Third-party cookies are being phased out as a result. By default, Firefox and Safari block them. Google intends to follow suit by 2023.
GA4 eliminates the need for cookies by using machine learning. It also provides you with predictive data to aid in identifying users and actions that may lead to a purchase. Product data patterns are automatically alerted by Google's AI-powered insights. These are the following:
- Purchase probability: The likelihood that a user who has been active in the previous 28 days will purchase in the following seven days.
- Churn probability: The chance that a user who has been active in the last seven days will not be active in the following seven days.
- Predicted revenue from purchases made in the next 28 days by active users in the previous 28 days.
Using this data, you may predict customer activities and adapt marketing campaigns to target high-value audiences.
Improved debugging
It can be difficult to tell whether Google Tag Manager or your website causes a problem when debugging in UA.
GA4 addresses issues by including a live debugging report called DebugView in the user interface. This allows you to keep track of real-time event data, as well as custom parameters and user settings.
Debug-enabled devices can also be isolated, and user data can be viewed. You may also import data directly into DebugView in real-time using the Google Tag Manager Chrome plugin to detect errors quickly.
Free BigQuery connection
BigQuery makes it simple to query huge and complex data sets, eliminating the issue of sampling that plagues sophisticated segment creation in GA.
This feature was previously exclusively available to GA360 users. However, all GA4 users can benefit from exporting raw event data to run queries and export to a third-party tool.
Recommended video: Exporting Data from Google Analytics 4 Properties to BigQuery
How does Google Analytics 4 help with reporting?
A data-gathering technique is only as effective as the information it yields.
So, how will moving to GA4 improve reporting?
With the increased emphasis on user privacy, monitoring consumers as they move between platforms and devices is becoming more challenging.
GA4 is a cutting-edge technology that employs advanced machine learning techniques to help fill in the gaps in missing data—creating a unified user experience for all data associated with the same identity.
Finally, GA4 made the reporting interface simpler, making it much easier for marketers to discover critical trends and anomalies in data.
GA4 employs overview reports in summary cards instead of a huge list of pre-configured reports that strive to cover every use case. Simply click on the scorecard if you want to learn more.
Types of Analysis in Google Analytics 4
Exploration
GA4 Exploration gives you more control over data visualization than Universal Analytics did previously.
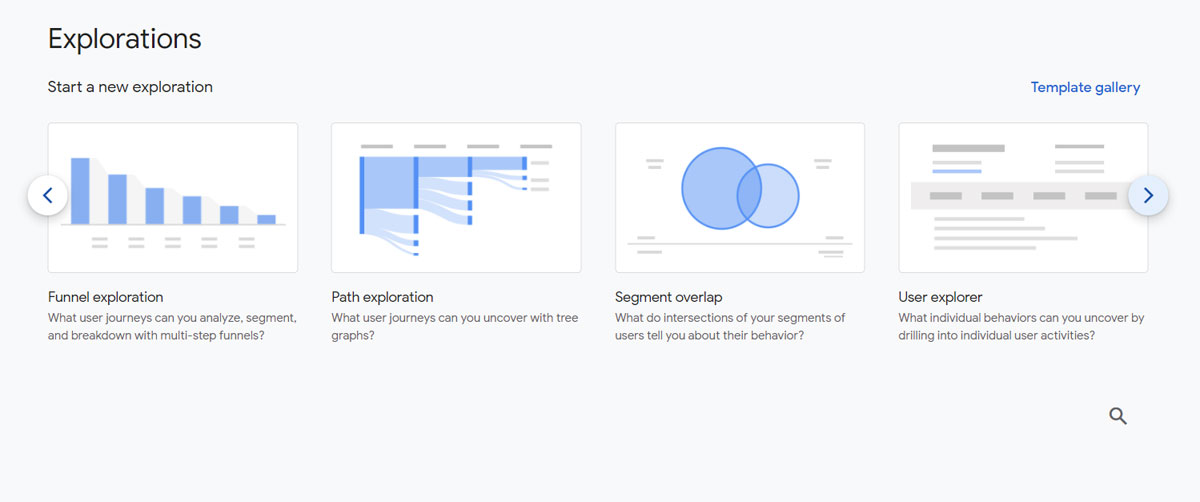
Within exploration, there are numerous configuration choices to help you discover new insights and present your data in a way that makes sense to your team or customer.
Funnel Analysis
How do one-time shoppers become repeat consumers, and how do one-time shoppers become repeat customers on a website?
In the GA4 funnel analysis report, you'll find out. You can observe how well buyers achieve or fail at each phase as you see their actions to accomplish an event.
Path Analysis
If you liked Universal Analytics' behavior flow reports, you'd adore GA4's analysis hub pathing reports.
Path analysis shows the event stream in a "tree graph." The events that users trigger along their path are called an event stream.
The path analysis technique aids marketers in identifying looping activity, which may suggest that customers are stuck.
Segment Overlap
Both Universal Analytics and Google Analytics 4 properties support segmentation.
Segments in GA4 can be used to represent user events or sessions. Marketers can even create segments with numerous conditions and group them together to form a "condition group."
Consider a segment to be a subset of your site's visitors. Those from a given city, those who viewed a specific page, or users who made a specific action, such as purchasing from a specific product category, are all examples of segments.
Cohort Analysis
A cohort is a group of users who have a common trait, such as the date of acquisition, an event, or a conversion.
You can use a cohort report to see how long it takes users to convert in relation to a certain marketing strategy.
User Lifetime
The user lifetime report is incredibly useful for search marketers since it allows you to generate analytics that shows which sources produce people with the highest lifetime revenue — not just revenue for a single month.
You may utilize GA4 to find the marketing efforts that are bringing in the most valuable users, with the highest buy probability and the lowest churn rate.
Recommended video: Deep dive on User Analysis Techniques in Google Analytics 4 Properties.
Final words
The future of web analytics is Google Analytics 4. It uses AI to intelligently collect user data, deliver statistics based on customer life cycles, and assist you in tailoring your advertising to your target demographic.
All of these factors combined to provide you a better probability of conversion and ROI, as well as future-proofing your company.
Got any questions? Ping me on Twitter.
Join over 145,000 SEO and Google Ads experts. We provide a community to help you engage and learn from industry experts and influencers. Join Now
World-class digital workplace software for a seamless employee experience, whether you have 10 or 10,000 employees.